04 / PUBLIC NOTE
电影院客户类别统计
题目
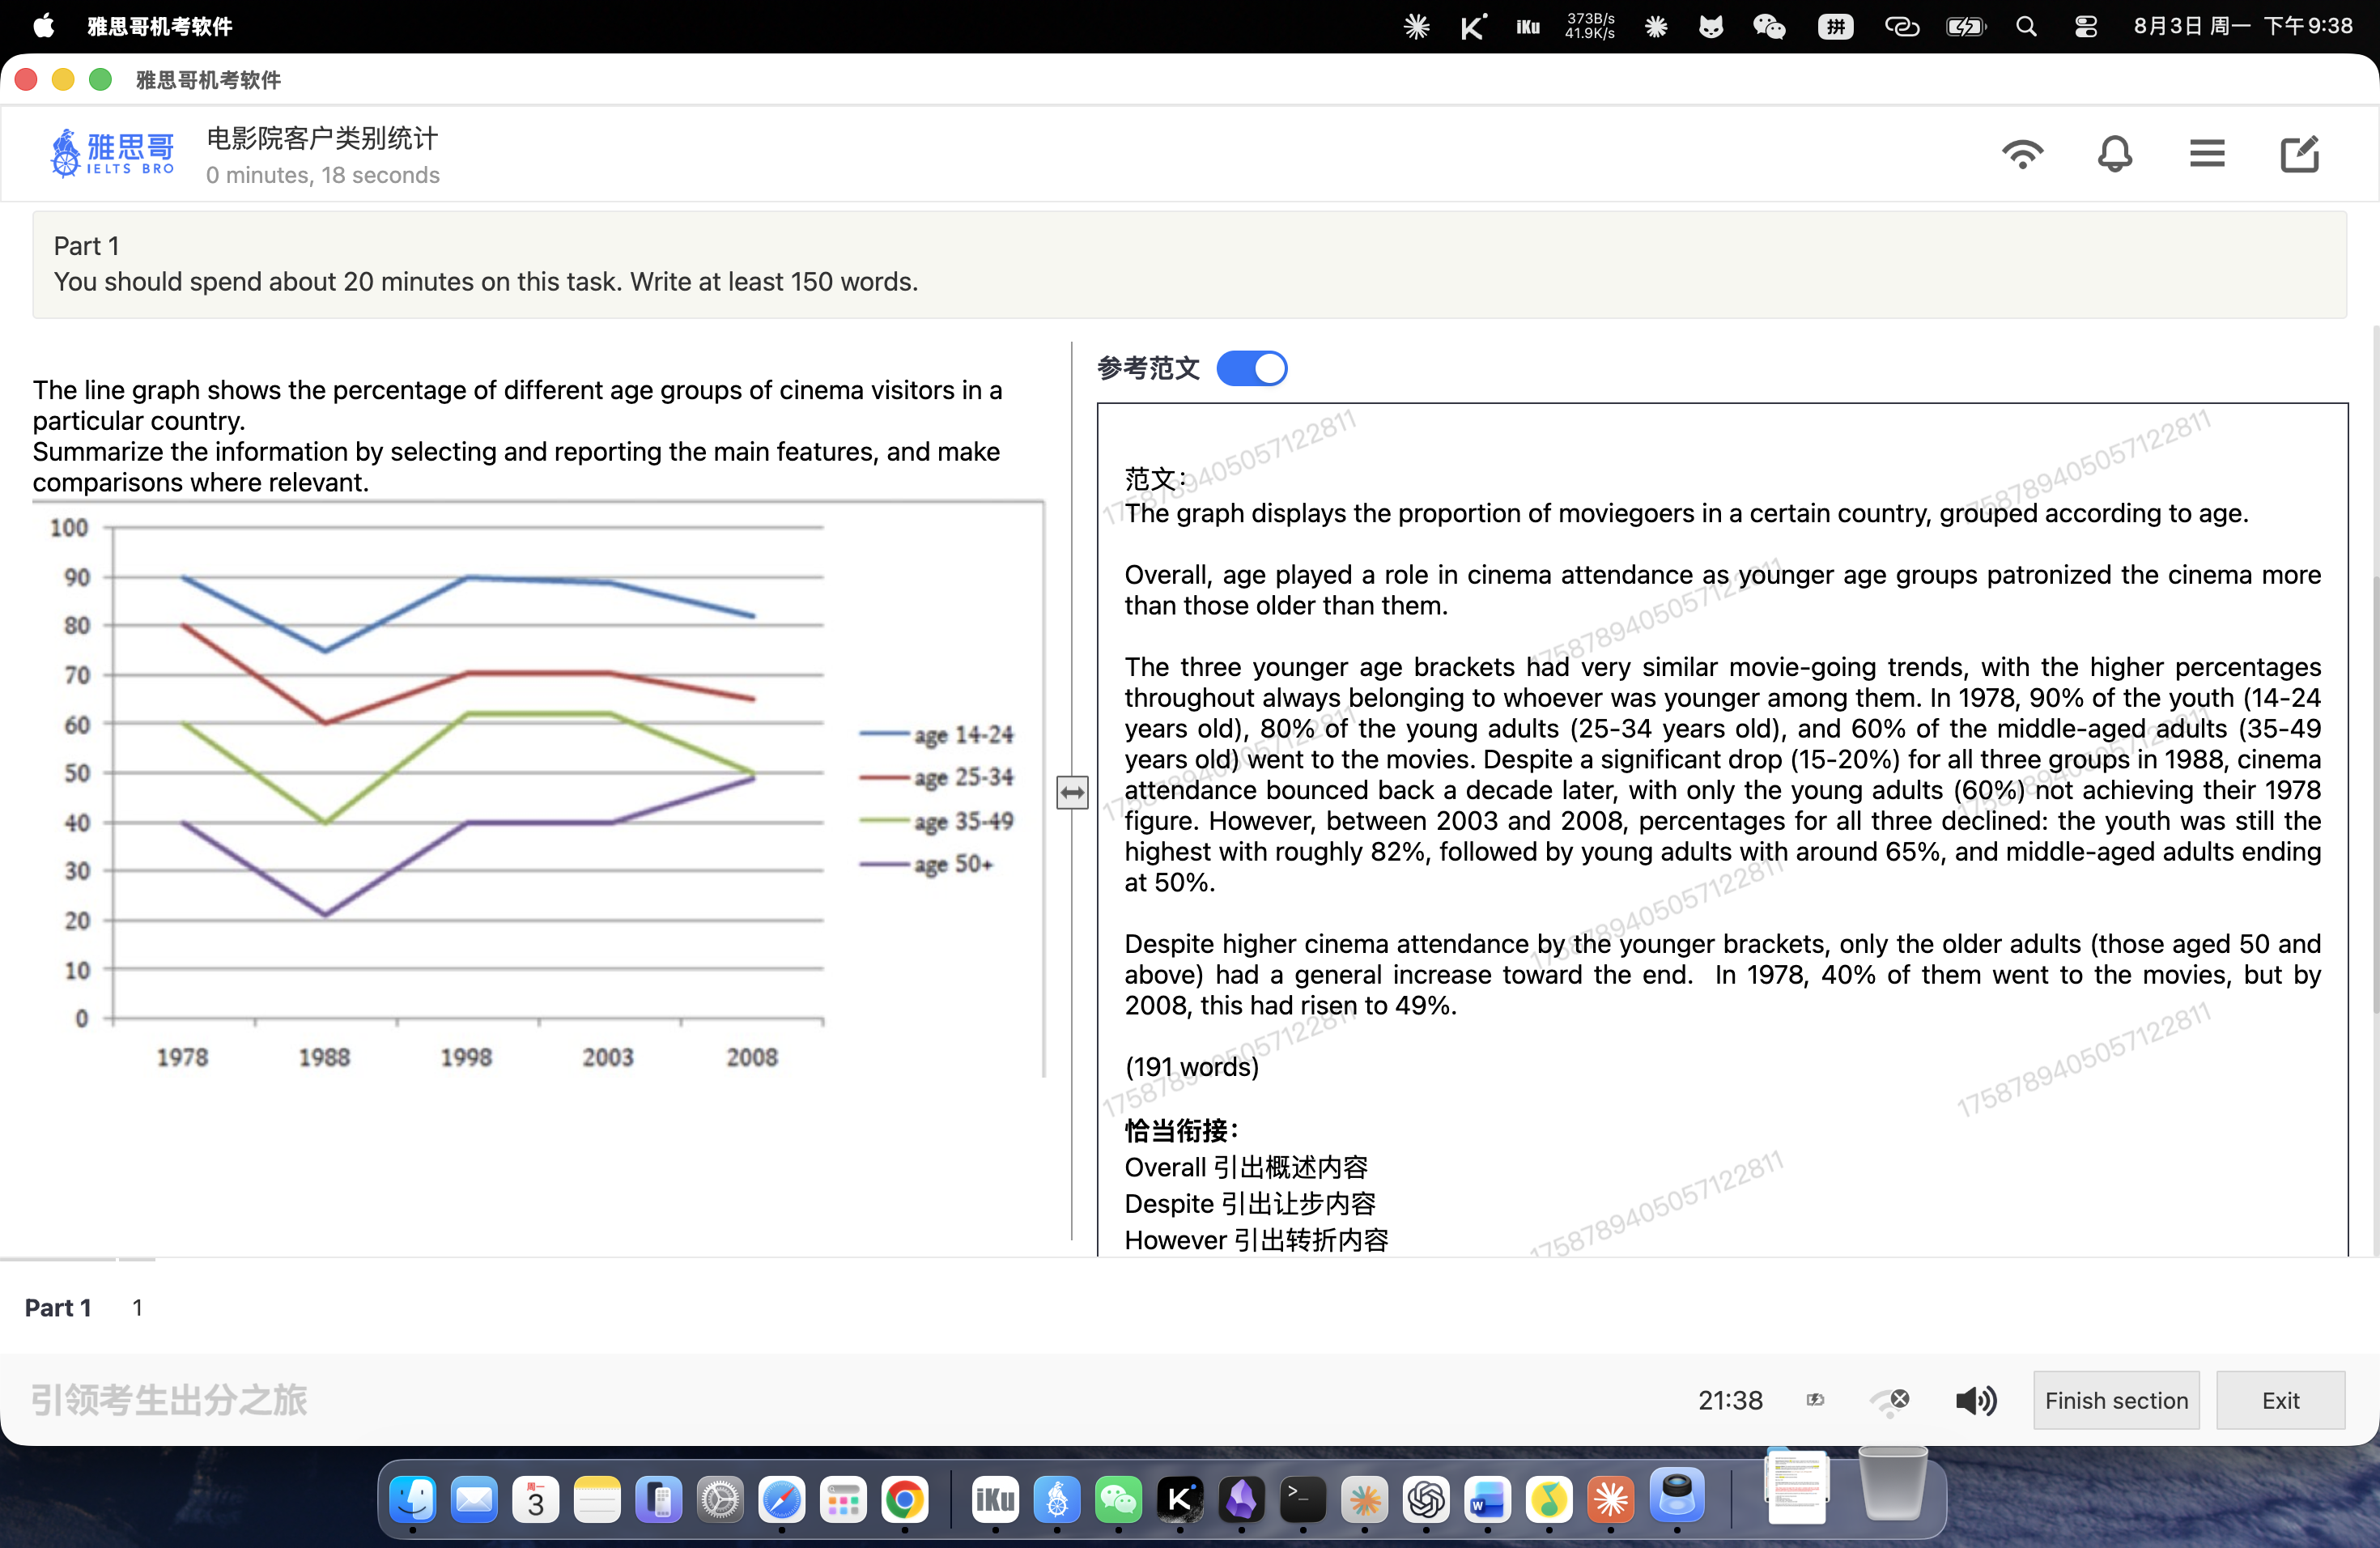
The line graph shows the percentage of different age groups of cinema visitors in a particular country. Summarize the information by selecting and reporting the main features, and make comparisons where relevant.
图表信息
- 图表类型:折线图;时间:1978–2008 年。
- 总体趋势:年龄越小,观影比例越高;三组较年轻人群在 1988 年下降后回升,50 岁以上人群则在期末略升。
范文
The graph displays the proportion of moviegoers in a certain country, grouped according to age.
Overall, age played a role in cinema attendance as younger age groups patronized the cinema more than those older than them.
The three younger age brackets had very similar movie-going trends, with the higher percentages throughout always belonging to whoever was youngest among them. In 1978, 90% of the youth (14–24 years old), 80% of the young adults (25–34 years old), and 60% of the middle-aged adults (35–49 years old) went to the movies. Despite a significant drop (15–20%) for all three groups in 1988, cinema attendance bounced back a decade later, with only the young adults (60%) not achieving their 1978 figure. However, between 2003 and 2008, percentages for all three declined: the youth was still the highest with roughly 82%, followed by young adults with around 65%, and middle-aged adults ending at 50%.
Despite higher cinema attendance by the younger brackets, only the older adults (those aged 50 and above) had a general increase toward the end. In 1978, 40% of them went to the movies, but by 2008, this had risen to 49%.
(191 words)
词汇与句型
moviegoers:常看电影的人;patronize:光顾;age brackets:年龄组;bounce back:反弹。Despite + 名词短语:Despite a significant drop ...。- 过去分词 + 现在分词:..., followed by young adults ..., and middle-aged adults ending at 50%.