04 / PUBLIC NOTE
电子游戏营收统计
题目
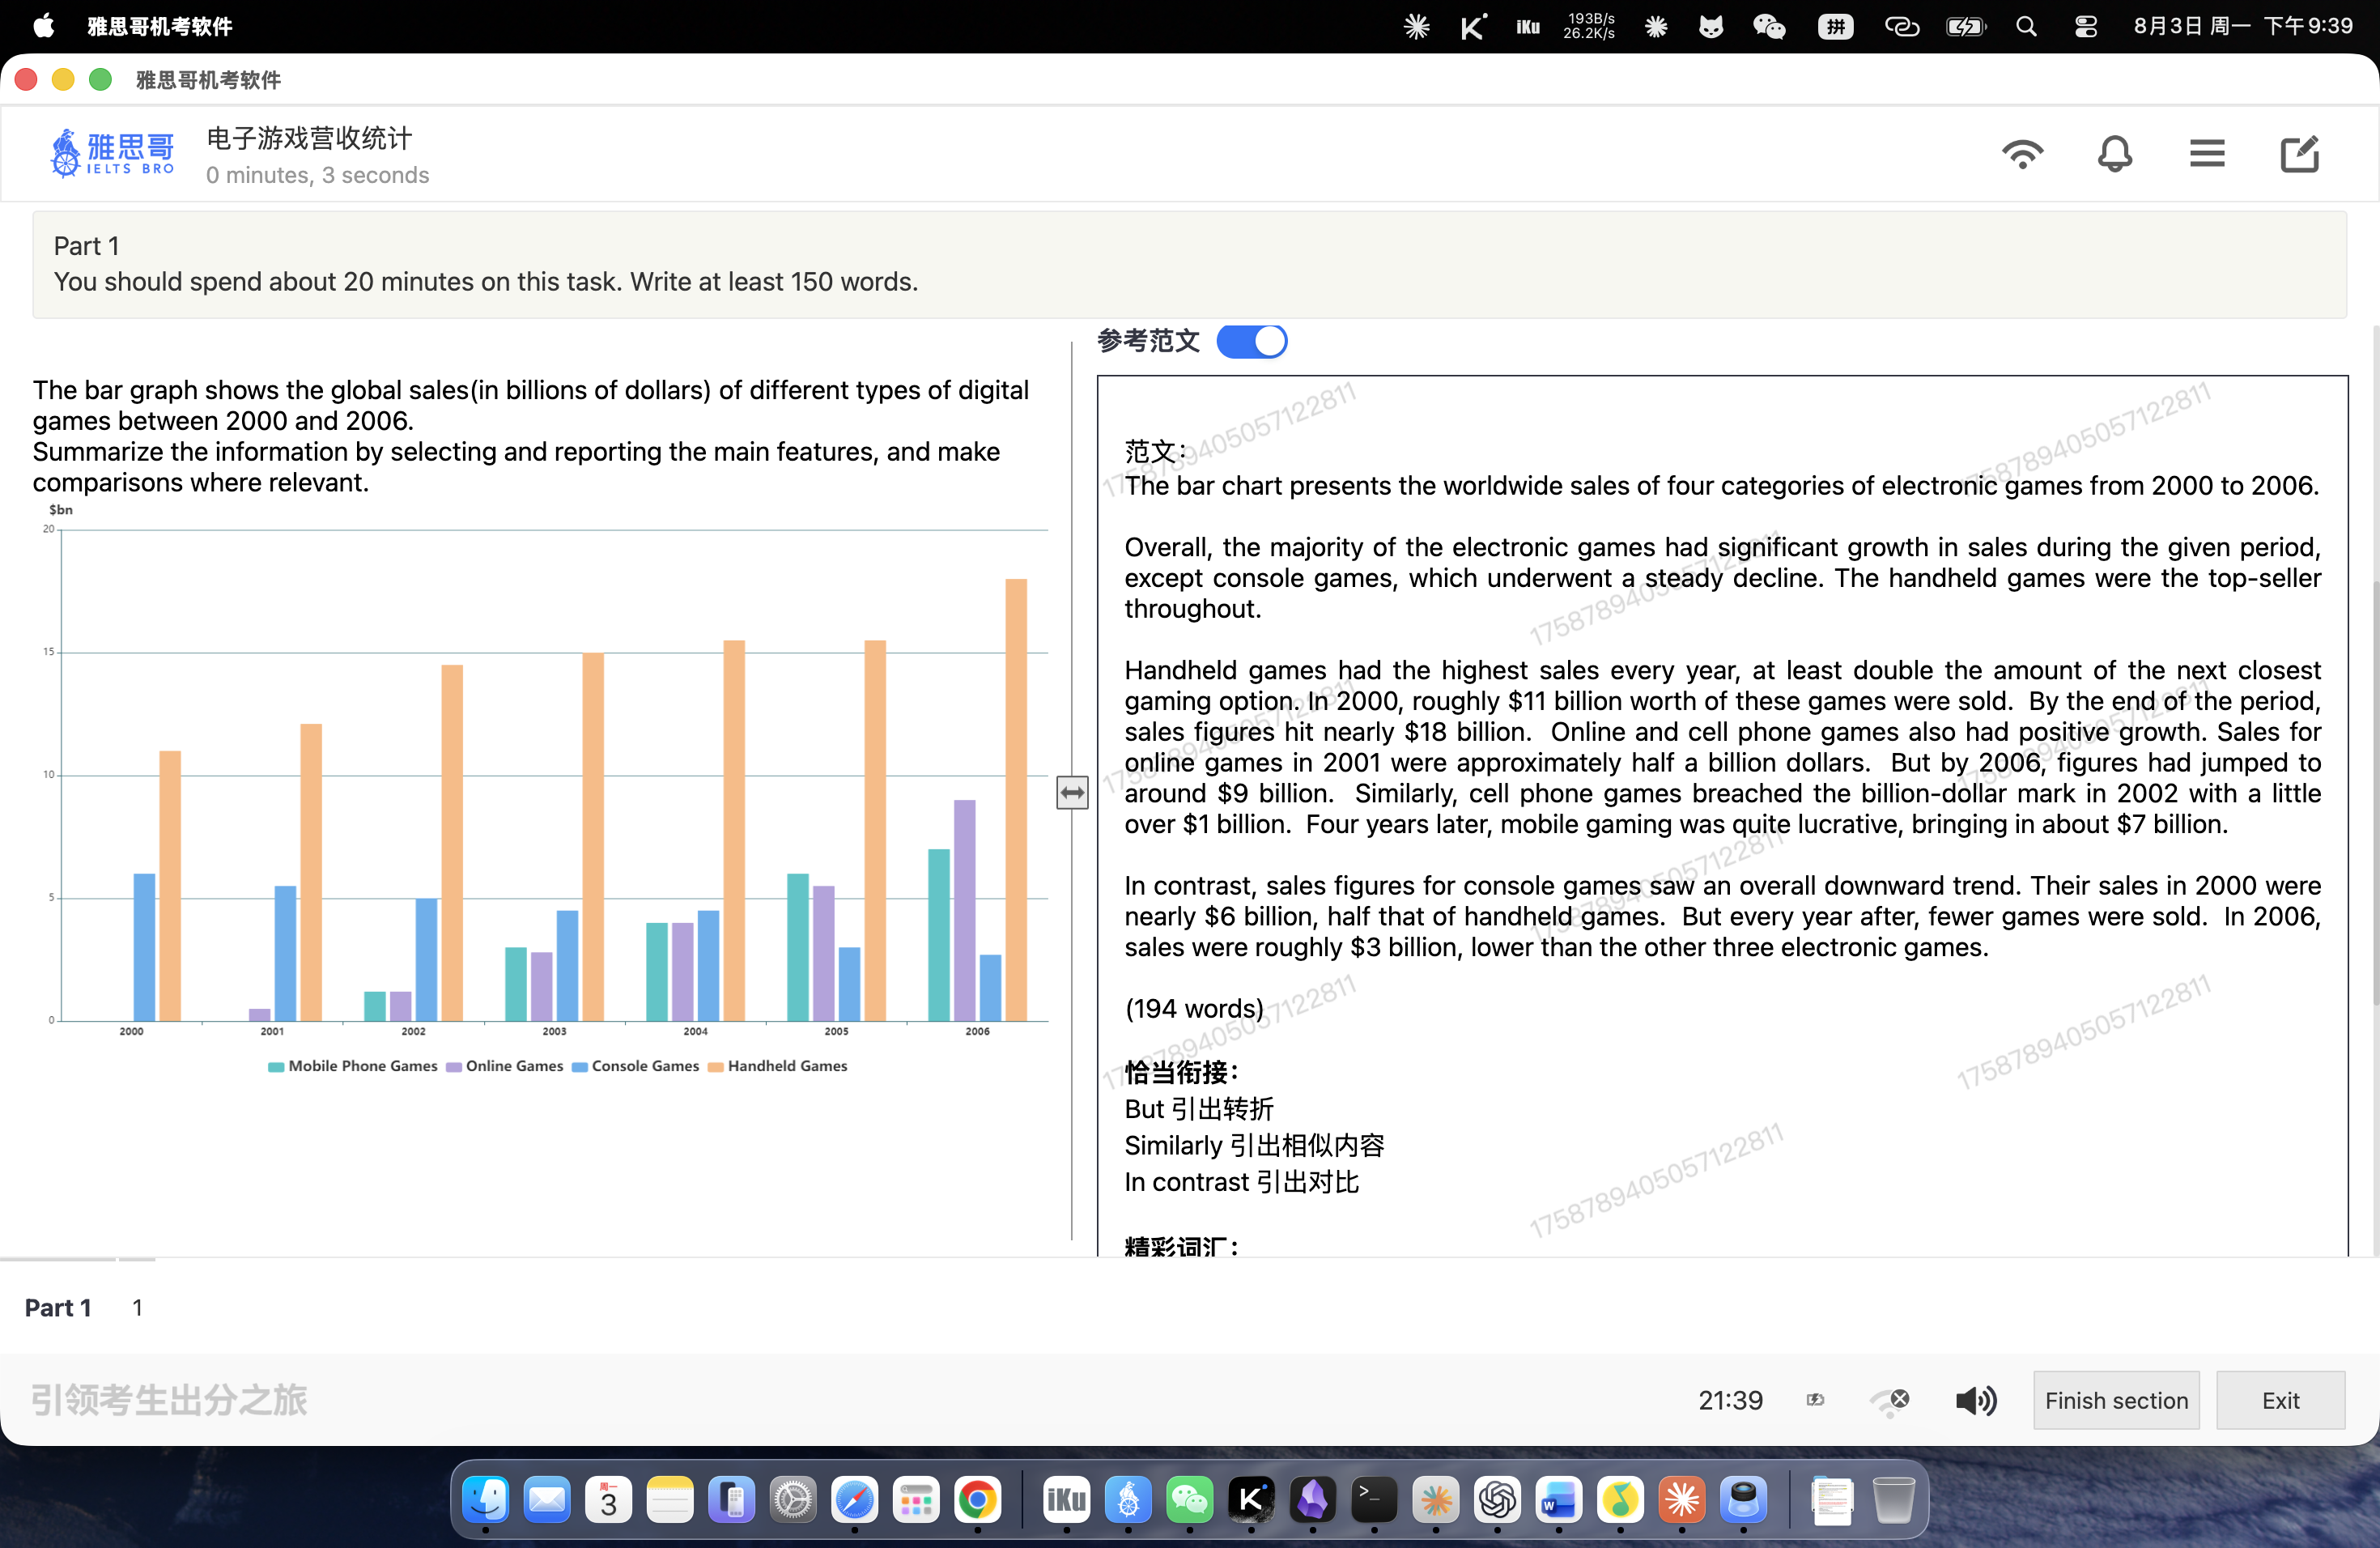
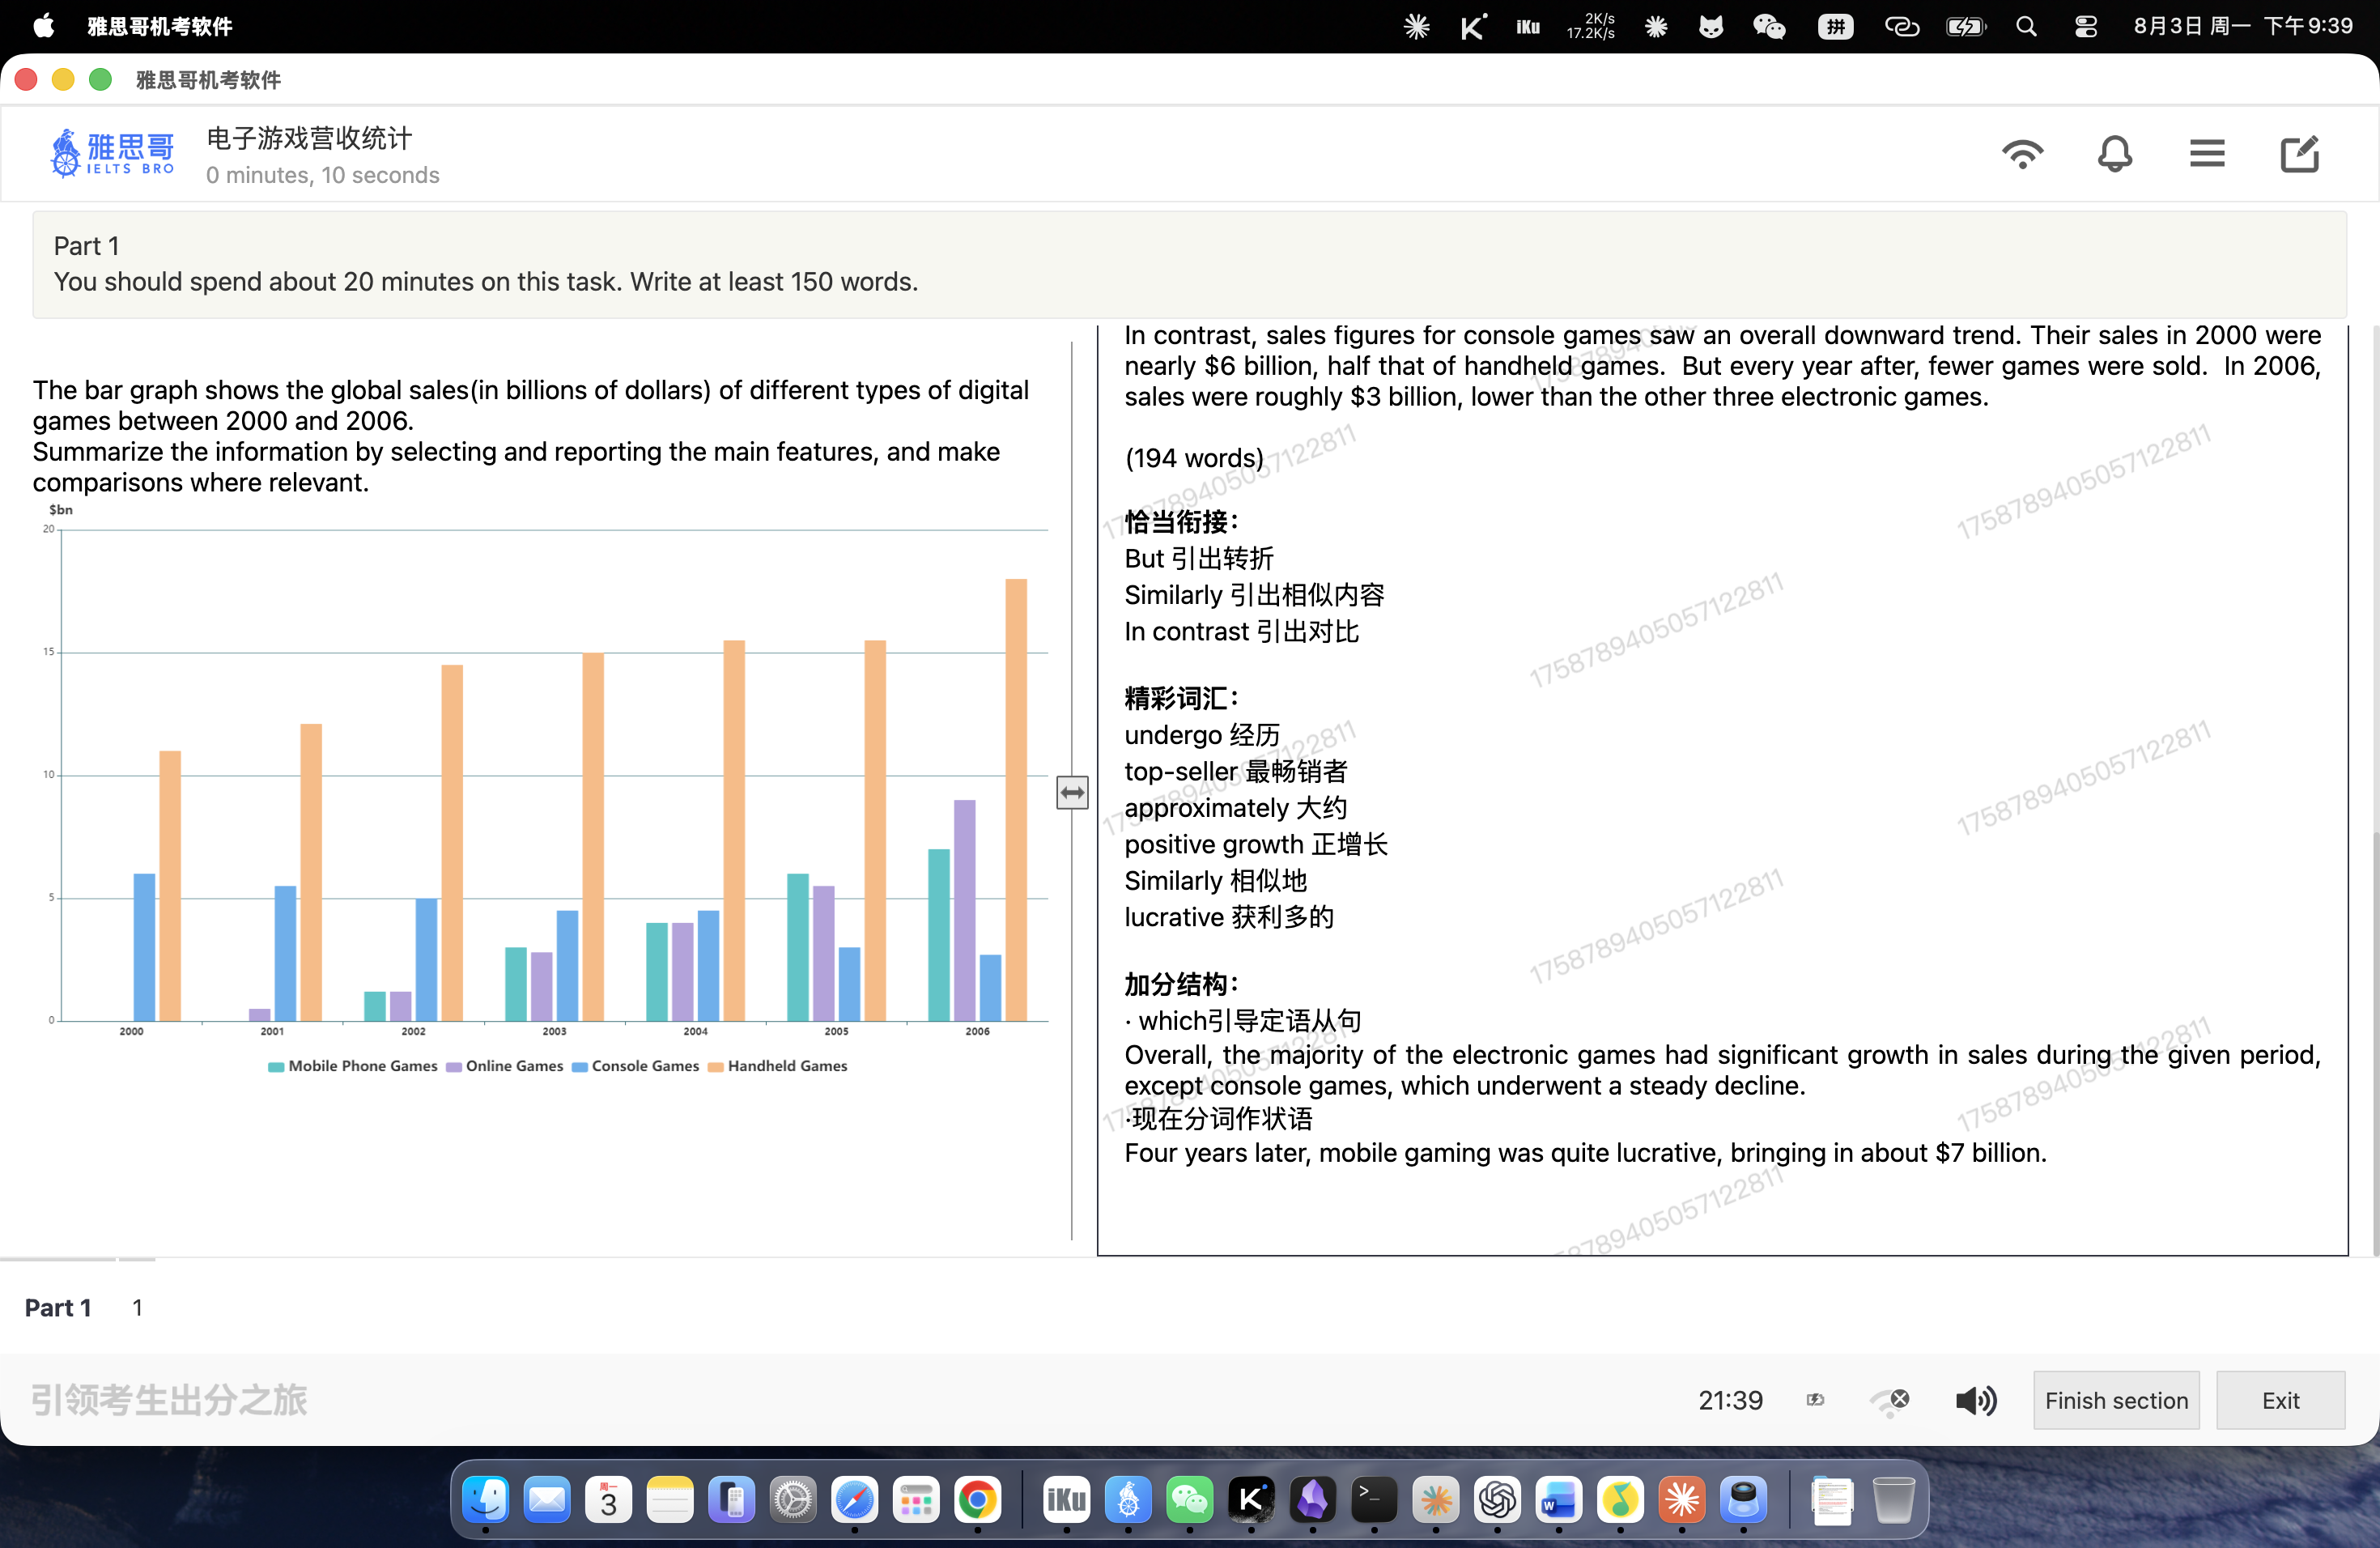
The bar graph shows the global sales (in billions of dollars) of different types of digital games between 2000 and 2006. Summarize the information by selecting and reporting the main features, and make comparisons where relevant.
图表信息
- 图表类型:柱状图;单位:十亿美元;时间:2000–2006 年。
- 总体趋势:handheld games 始终最高并增长;mobile phone 和 online games 增长明显;console games 持续下降。
范文
The bar chart presents the worldwide sales of four categories of electronic games from 2000 to 2006.
Overall, the majority of the electronic games had significant growth in sales during the given period, except console games, which underwent a steady decline. The handheld games were the top-seller throughout.
Handheld games had the highest sales every year, at least double the amount of the next closest gaming option. In 2000, roughly $11 billion worth of these games were sold. By the end of the period, sales figures hit nearly $18 billion. Online and cell phone games also had positive growth. Sales for online games in 2000 were approximately half a billion dollars. But by 2006, figures had jumped to around $9 billion. Similarly, cell phone games breached the billion-dollar mark in 2002 with a little over $1 billion. Four years later, mobile gaming was quite lucrative, bringing in about $7 billion.
In contrast, sales figures for console games saw an overall downward trend. Their sales in 2000 were nearly $6 billion, half that of handheld games. But every year after, fewer games were sold. In 2006, sales were roughly $3 billion, lower than the other three electronic games.
(194 words)
词汇与句型
top-seller:最畅销者;undergo a steady decline:经历持续下降;lucrative:获利多的;breach the billion-dollar mark:突破十亿美元。which定语从句:console games, which underwent a steady decline。- 现在分词作状语:..., bringing in about $7 billion.